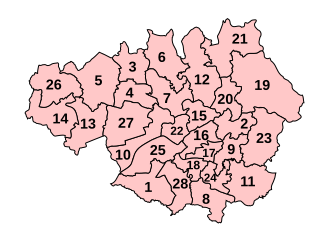
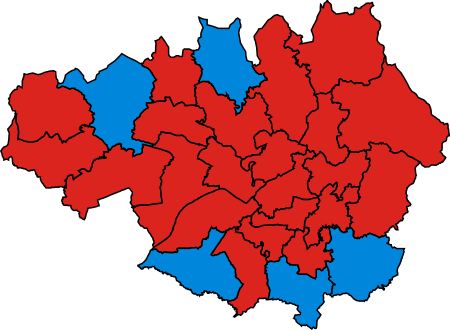
Parliamentary constituencies in Greater Manchester
The ceremonial and metropolitan county of Greater Manchester is divided into 27 parliamentary constituencies—19 borough constituencies and 8 county constituencies. At the 2024 general election in Greater Manchester, Labour won 25 seats and the Liberal Democrats won 2.
Constituencies
[edit]Conservative Party Green Party Independent Labour Party Liberal Democrats Reform UK Workers Party of Britain
Boundary changes
[edit]2024
[edit]See 2023 Periodic Review of Westminster constituencies for further details.
For the 2023 Periodic Review of Westminster constituencies, which redrew the constituency map ahead of the 2024 United Kingdom general election, the Boundary Commission for England proposed that Greater Manchester be considered as a sub-region of the North West Region, retaining a total of 27 constituencies. However, there were significant changes made to realign boundaries to revised ward boundaries and ensure electorates were within the statutory range. Denton and Reddish was abolished and broken up and Manchester Rusholme re-established, resulting in major re-configurations of the Manchester Central and Manchester Gorton constituencies, with the latter being renamed Gorton and Denton. Other boundary changes resulted in name changes as follows:[1][2][3]
In addition, although unchanged, Oldham West and Royton was renamed Oldham West, Chadderton and Royton.
The following are the constituencies in place following the changes:
Containing electoral wards in the borough of Bolton
Containing electoral wards in the borough of Bury
- Bury North
- Bury South (part)
Containing electoral wards in the city of Manchester
- Gorton and Denton (part)
- Blackley and Middleton South (part)
- Manchester Central (part)
- Manchester Rusholme
- Manchester Withington
- Wythenshawe and Sale East (part)
Containing electoral wards in the borough of Oldham
- Manchester Central (part)
- Oldham East and Saddleworth
- Oldham West, Chadderton and Royton
Containing electoral wards in the borough of Rochdale
- Blackley and Middleton South (part)
- Heywood and Middleton North
- Rochdale
Containing electoral wards in the city of Salford
- Bolton South and Walkden (part)
- Bury South (part)
- Salford
- Worsley and Eccles (part)
Containing electoral wards in the borough of Stockport
Containing electoral wards in the borough of Tameside
- Ashton-under-Lyne
- Gorton and Denton (part)
- Stalybridge and Hyde
Containing electoral wards in the borough of Trafford
- Altrincham and Sale West
- Stretford and Urmston
- Wythenshawe and Sale East (part)
Containing electoral wards in the borough of Wigan
- Leigh and Atherton
- Makerfield
- Wigan
- Worsley and Eccles (part)
2010
[edit]Under the Fifth Periodic Review of Westminster constituencies, the Boundary Commission for England decided to reduce the number of seats in Greater Manchester from 28 to 27, leading to significant changes in the city of Salford, where the three constituencies of Eccles, Salford and Worsley were abolished and replaced by the two constituencies of Salford and Eccles, and Worsley and Eccles South. Manchester, Blackley was replaced with Blackley and Broughton.
1997 boundaries
[edit]| Name 1997-2010 | Boundaries 1997-2010 | |
|---|---|---|
 | ||
2010 boundaries
[edit]| Name 2010-2024 | Boundaries 2010-2024 | |
|---|---|---|
 | ||
Results history
[edit]Primary data source: House of Commons research briefing - General election results from 1918 to 2019[4]
2024
[edit]The number of votes cast for each political party who fielded candidates in constituencies comprising Greater Manchester in the 2024 general election were as follows:
| Party | Votes | % | Change from 2019 | Seats | Change from 2019 | |
|---|---|---|---|---|---|---|
| Labour | 471,074 | 42.8% | 25 | |||
| Reform UK | 191,257 | 17.4% | 0 | 0 | ||
| Conservative | 173,735 | 15.8% | 0 | |||
| Liberal Democrats | 95,978 | 8.7% | 2 | |||
| Green | 89,203 | 8.1% | 0 | 0 | ||
| Others | 79,496 | 7.2% | 0 | 0 | ||
| Total | 1,100,743 | 100.0 | 27 | |||
2019
[edit]The number of votes cast for each political party who fielded candidates in constituencies comprising Greater Manchester in the 2019 general election were as follows:
| Party | Votes | % | Change from 2017 | Seats | Change from 2017 | |
|---|---|---|---|---|---|---|
| Labour | 597,271 | 47.9% | 18 | |||
| Conservative | 435,651 | 34.9% | 9 | |||
| Liberal Democrats | 109,555 | 8.8% | 0 | 0 | ||
| Brexit Party | 68,462 | 5.5% | new | 0 | 0 | |
| Green | 29,642 | 2.4% | 0 | 0 | ||
| Others | 6,602 | 0.5% | 0 | 0 | ||
| Total | 1,247,183 | 100.0 | 27 | |||
Percentage votes
[edit]| Election year | 1983 | 1987 | 1992 | 1997 | 2001 | 2005 | 2010 | 2015 | 2017 | 2019 | 2024 | |
|---|---|---|---|---|---|---|---|---|---|---|---|---|
| Labour | 39.7 | 44.0 | 47.3 | 56.3 | 53.7 | 47.2 | 40.3 | 46.1 | 56.9 | 47.9 | 42.8 | |
| Reform UK1 | - | - | - | - | - | - | - | - | - | 5.5 | 17.4 | |
| Conservative | 36.2 | 35.9 | 35.5 | 24.1 | 24.3 | 23.7 | 27.3 | 26.4 | 32.5 | 34.9 | 15.8 | |
| Liberal Democrats2 | 23.6 | 19.9 | 15.7 | 16.0 | 18.3 | 23.3 | 23.8 | 7.1 | 6.1 | 8.8 | 8.7 | |
| Green | - | * | * | * | * | * | 0.6 | 3.5 | 1.0 | 2.4 | 8.1 | |
| UKIP | - | - | - | * | * | * | 3.2 | 16.1 | 2.8 | * | * | |
| Other | 0.5 | 0.1 | 1.6 | 3.5 | 3.7 | 5.8 | 4.8 | 0.8 | 0.7 | 0.5 | 7.2 | |
1As the Brexit Party in 2019 21983 & 1987 - SDP-Liberal Alliance
* Included in Other
Seats
[edit]| Election year | 1983 | 1987 | 1992 | 1997 | 2001 | 2005 | 2010 | 2015 | 2017 | 2019 | 2024 | |
|---|---|---|---|---|---|---|---|---|---|---|---|---|
| Labour | 18 | 19 | 20 | 25 | 25 | 23 | 22 | 22 | 23 | 18 | 25 | |
| Liberal Democrats1 | 1 | 1 | 1 | 1 | 2 | 4 | 3 | 0 | 0 | 0 | 2 | |
| Conservative | 11 | 10 | 9 | 2 | 1 | 1 | 2 | 5 | 4 | 9 | 0 | |
| Total | 30 | 30 | 30 | 28 | 28 | 28 | 27 | 27 | 27 | 27 | 27 | |
11983 & 1987 - SDP-Liberal Alliance
Maps
[edit]-
1983
-
1987
-
1992
-
1997
-
2001
-
2005
-
2010
-
2015
-
2017
-
2019
-
2024
Historical representation by party
[edit]A cell marked → (with a different colour background to the preceding cell) indicates that the previous MP continued to sit under a new party name.
1983 to 2010
[edit]Conservative Labour Liberal Liberal Democrats
2010 to present
[edit]Change UK Conservative Independent Independent Labour Labour Liberal Democrats Workers
See also
[edit]- Constituencies of the Parliament of the United Kingdom
- Parliamentary constituencies in North West England
Notes
[edit]- ^ BC denotes borough constituency, CC denotes county constituency.
References
[edit]- ^ Green, Charlotte (11 November 2022). "Radical boundaries shake-up scaled back". Manchester Evening News. Retrieved 13 December 2022.
- ^ Green, Charlotte (9 June 2021). "Nearly every GM constituency boundaries could soon look radically different". Manchester Evening News. Retrieved 17 October 2021.
- ^ "The 2023 Review of Parliamentary Constituency Boundaries in England – Volume one: Report". Boundary Commission for England. paras 815-862. Retrieved 10 July 2023.
- ^ Watson, Christopher; Uberoi, Elise; Loft, Philip (17 April 2020). "General election results from 1918 to 2019".


